Plotting
torchnep.plot.NEPPlotter draws figures straight from the files a run writes — loss.out, energy/force/virial/stress_train.out and *_test.out — and from the output of predict_dataset. It needs matplotlib: pip install torchnep[plot].
"run" is the output directory of a training run (or of predict_dataset). Every figure below comes from the same run: a Cr-Co-Ni model trained for 600 epochs with valid_ratio=0.1.
Dashboard
One figure per run: the training curves plus the energy, force and stress parity plots, both sets overlaid.
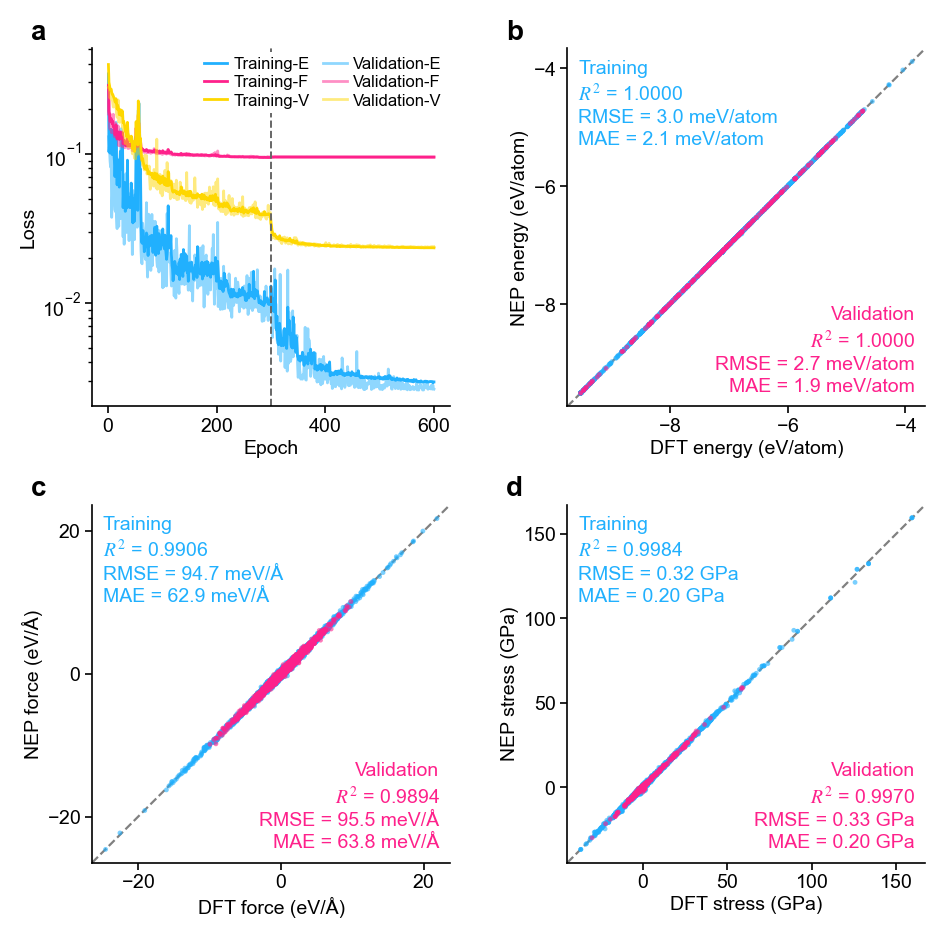
p.dashboard("run")virial=True puts the virial in the third panel instead of the stress; without stress labels the figure becomes one row of three panels.
Loss curves
The E / F / V RMSEs against the epoch, training solid and validation faint in the same colour, with a dashed line where stage 2 starts. stress=True adds the stress RMSE.
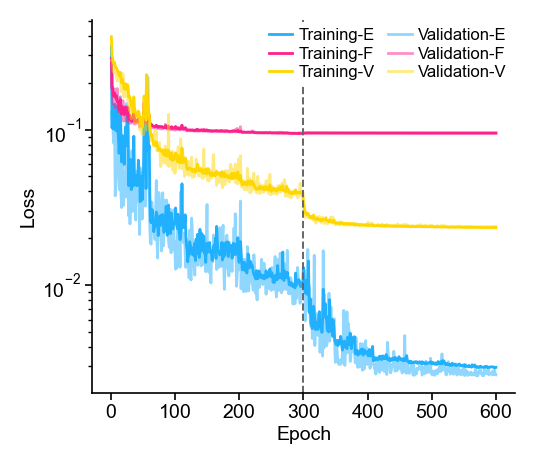
p.loss("run")Parity plots
Energy, force and stress, with R², RMSE and MAE per set. quantities picks the panels (E, F, V, S), size sets the side of one panel in cm.
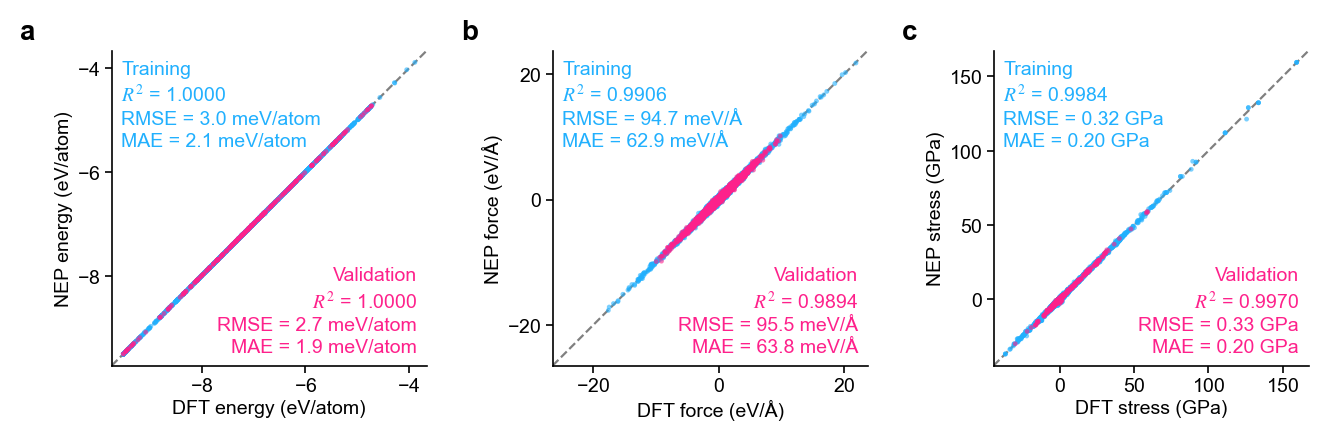
p.parity("run")Density instead of points
kind="density"counts the points into hexagonal cells — readable for millions of force components, and the counting runs in chunks so hundreds of millions of points fit in memory.binssets the cell size andcell="square"switches the cell shape.margins=Trueadds a strip above each panel with the error (NEP − DFT) against the DFT value.- The colormaps are reversed, so the sparse cells — the outliers — are the dark ones (
cmap_reverse=Falsefor the usual direction).
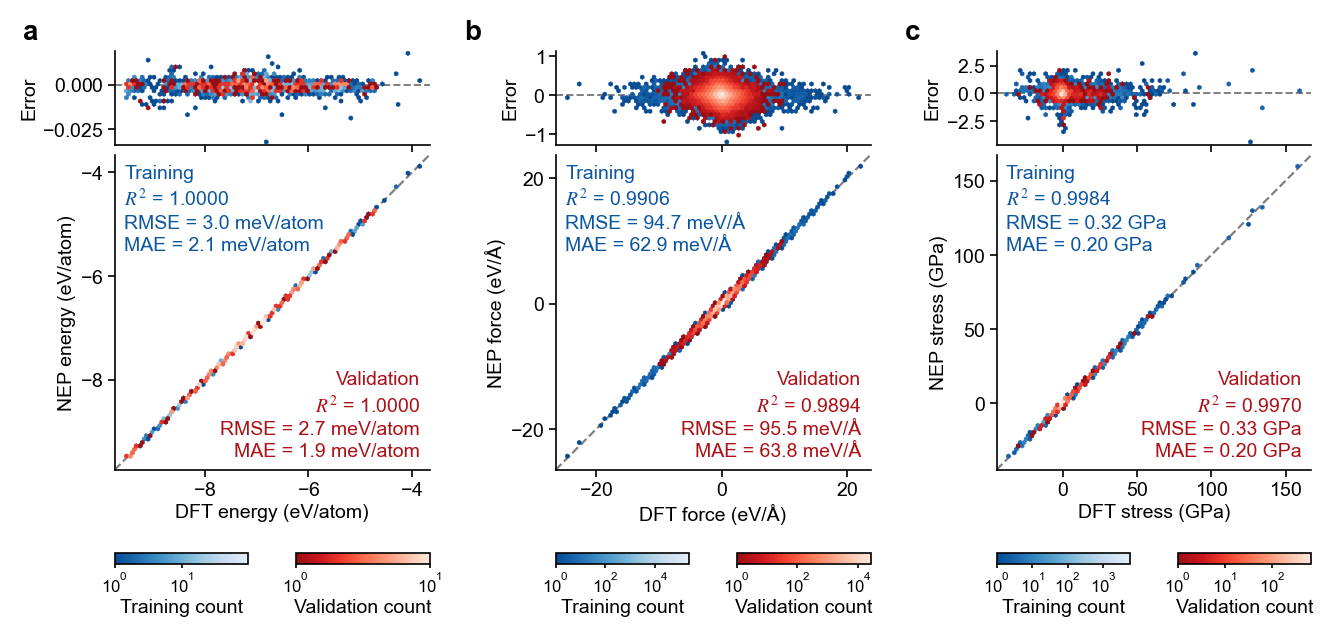
p.parity("run", kind="density", margins=True)Data from another DFT reference
When the reference energies come from other DFT settings, remove the per-element energy offset first, otherwise the energy panel only shows that offset:
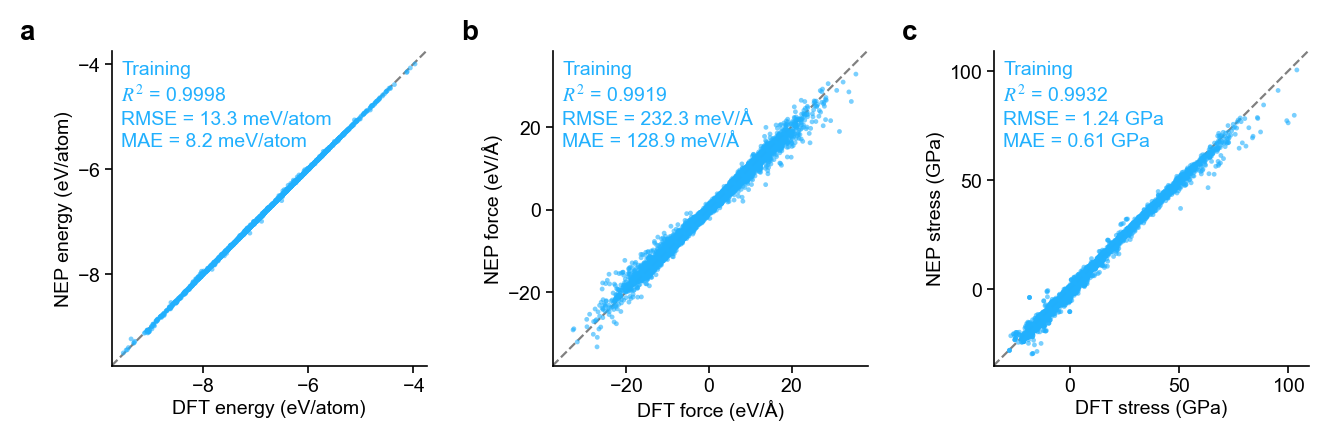
p.parity("pred", shift_energy="element", xyz="other_data.xyz") — the same model predicting a set labelled with a different DFT setupshift_energy="mean" removes one global offset instead. exclude= leaves listed training frames out, e.g. known outliers (with natoms= or xyz=, so their force rows go too).
Error distributions
One histogram of NEP − DFT per quantity on a log count axis, training and validation overlaid in the parity colours, each annotated with its RMSE, MAE and largest error; the last panel shows the force error against the force magnitude.
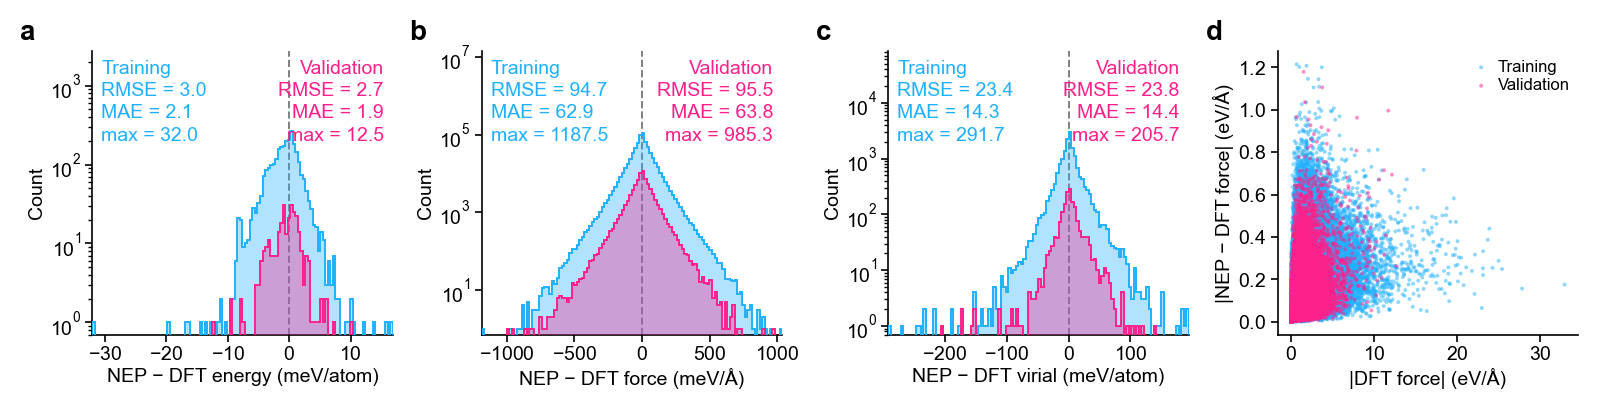
p.errors("run")quantities picks the panels, force_magnitude=False drops the last one, bins sets the histogram bins and shift_energy works as in parity. Errors per element have their own figure, below.
Errors per element
Each element is coloured by its energy and force RMSE; elements without data stay grey, and families=True outlines the chemical families. element_errors(path, xyz) returns the same numbers as a dict.
Which xyz belongs to the outputs
*_train.out holds the training split. With valid_ratio, write that split out with export_valid_split (same run_seed and valid_strategy) and pass its train.xyz; *_test.out pairs with the test.xyz of the same call.
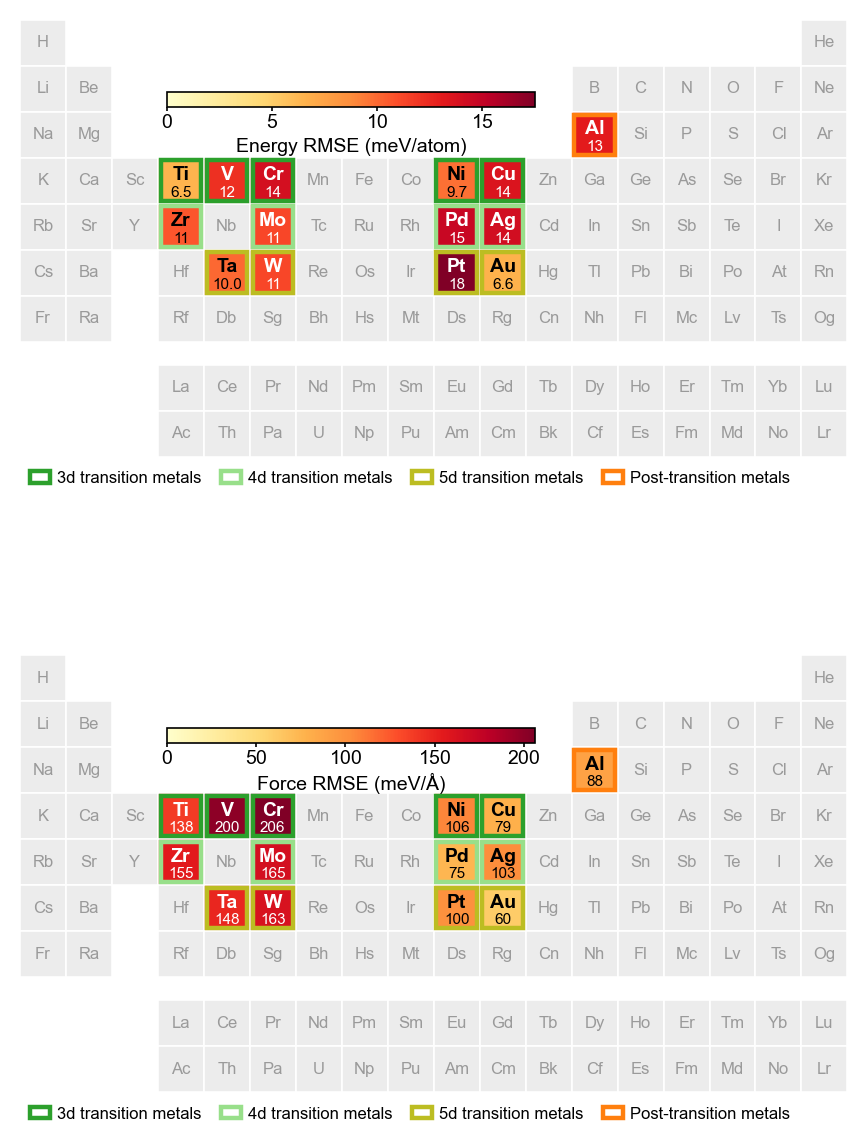
p.periodic_table(path="pred", xyz="test.xyz", families=True) — a 16-element model on its test setPass values={label: {element: value}} to colour the table by your own numbers instead.
Style
The constructor sets the style of every figure:
| Argument | Default | Meaning |
|---|---|---|
font |
"Arial" |
Font family; matplotlib's default when it is not installed. |
font_dir |
TORCHNEP_FONT_DIR |
Folder of .ttf / .otf files to register first. |
fontsize |
7 |
Base font size in points. |
dpi |
300 |
Figure and file resolution. |
colors |
built-in | Colours of the training / validation sets and of the E/F/V/S curves. |
cmaps, cmap_range, cmap_reverse |
Blues / Reds, (0.1, 0.9), True |
Density colormaps and the part of them used. |
max_points |
300000 |
Points drawn in a scatter panel; the metrics always use every point. |
panel_labels, label_format, label_weight |
"abcd…", "{}", bold |
Panel labels; None for none. |
frame |
False |
Full box with ticks on all four sides. |
rc |
None |
Extra matplotlib rcParams. |
Every method takes out= to save the figure and returns the matplotlib figure; called without out=, the figure stays open for further editing.