Phase diagrams of two elements
mdapy.simulation.binary_phase_diagram(phases, temperatures) gives the phase diagram
of two elements from the free energies of their phases: at each
temperature the stable phases at each composition lie on the lower convex hull of the
free energies.
import numpy as np

from mdapy.build import build_crystal, random_alloy
from mdapy.calculators import LAMMPS
from mdapy.simulation import binary_phase_diagram, free_energy, minimize

potential = LAMMPS("pair_style nep\npair_coeff * * nep.txt Cu Ni", ["Cu", "Ni"])
temperatures = np.arange(900.0, 2101.0, 25.0)
solid, liquid = {}, {}
for x in (0.0, 0.25, 0.5, 0.75, 1.0):
    a = 3.63 * (1 - x) + 3.52 * x
    atoms = random_alloy(
        build_crystal("fcc", a, repeat=(8, 8, 8)), {"Cu": 1 - x, "Ni": x}, seed=7
    )
    atoms = minimize(atoms, potential, cell="full", max_stress=1e-2).system
    options = dict(switching=50, scan=200, repeats=2)
    solid[x] = free_energy(atoms, potential, temperatures, mixing=0 < x < 1, **options)
    liquid[x] = free_energy(
        atoms,
        potential,
        temperatures[::-1],
        phase="liquid",
        equilibration=15,
        melt_temperature=2800,
        **options,
    )

diagram = binary_phase_diagram(
    {"fcc": solid, "liquid": liquid},
    np.arange(1100.0, 1701.0, 5.0),
    elements=("Cu", "Ni"),
    degree=3,
)
diagram.phases_at(1400.0, 0.5)  # the stable phases, one or two
diagram.tie_lines[0]  # which two phases, at which fractions
The diagram, with plot.phase_diagram:
from mdapy.visualization import plot

with plot.style():
    fig, ax = plot.figure("single")
    plot.phase_diagram(diagram, ax=ax)
    plot.save(fig, "images/phase-diagram", formats=("png",))
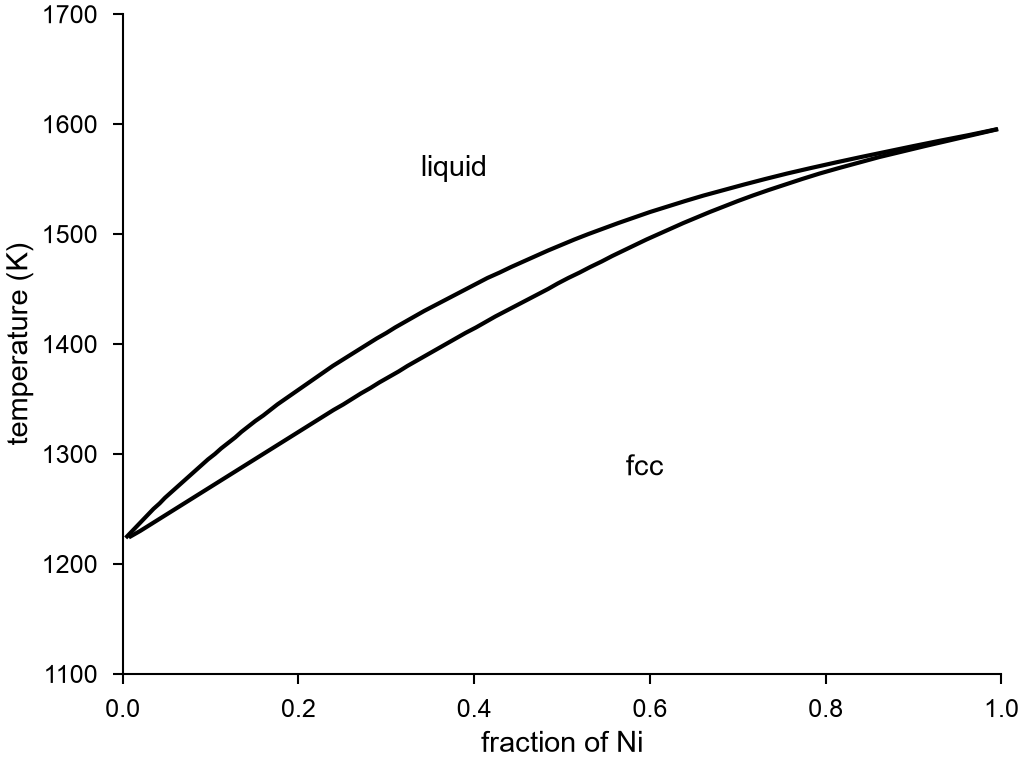
Copper and nickel with the UNEP16 model (Song et al. (2024); Wu et al. (2026)) through the LAMMPS interface of NEP, 2048 atoms at five compositions: a solid solution at all compositions below a lens, as in the experiments. The model melts its elements lower than the experiments do: copper at 1220 K against 1358 K, nickel at 1590 K against 1728 K.
| Name | Type | Default | Unit | Meaning |
|---|---|---|---|---|
phases |
mapping | for each phase, its free energies by the fraction of the second element: each a FreeEnergyResult, or a pair of (T,) temperatures in K and (T,) free energies in eV per atom |
||
temperatures |
array_like | K | the temperatures of the diagram | |
elements |
2 str | ("A", "B") |
the elements, for the labels | |
points |
int32 | 1001 | the number of fractions from 0 to 1 | |
degree |
int32 | 4 | the largest degree of the polynomials |
A phase of one fraction is a compound of that composition. A phase of more is a solution between its lowest and its highest fractions: at each temperature the free energy minus that of ideal mixing is a polynomial of the fraction, through the given points as closely as its degree allows. Beyond its temperatures a free energy goes on along a straight line; a phase there is usually one that has already lost to another, as a crystal above the temperature to which it stayed a crystal.
The free energies must include the entropy of mixing, which
free_energy gives a liquid by itself and a random solid solution
with mixing=True. Short-range order in a solid solution, which the dynamics cannot
reach, is left out. All free energies must be at one pressure.
For a phase diagram at 0 K of any number of elements, from energies of formation,
see the PhaseDiagram of pymatgen, to which a free energy at
one temperature can be given as the energy of an entry.
Results
binary_phase_diagram returns a BinaryPhaseDiagram; arrays are read-only.
| Attribute or method | Type | Meaning |
|---|---|---|
elements |
tuple of str | the two elements; the fraction is that of the second |
phases |
tuple of str | the names of the phases |
temperatures |
(T,) float64 | the temperatures in K |
fractions |
(X,) float64 | the fractions of the second element |
stable |
(T, X) int64 | the index in phases of the one stable phase, or -1 where two coexist |
tie_lines |
tuple of TieLine |
each pair of phases in equilibrium |
phases_at(temperature, fraction) |
tuple of str | the one or two stable phases at the nearest temperature of the diagram |
A TieLine has temperature in K, first and second, the phases, the first at the
lower fraction, and first_fraction and second_fraction.
plot.phase_diagram(result, *, ax=None, labels=True) draws where the tie lines end
against the temperature, with the name of each phase in the middle of where it is the
only one.
Definition
With \(G_p(x, T)\) the free energy per atom of phase \(p\) at a fraction \(x\) of the second element, the stable phases at \(T\) are those on the lower convex hull of all \(G_p(x, T)\) against \(x\). A straight piece of the hull between two points is a tie line: two phases with the same chemical potentials of both elements. A solution has
Errors
binary_phase_diagram raises InvalidParameter for no phases, a phase with no free
energies, a fraction out of range, no phase at the fractions 0 or 1, free energies with
another number of values than temperatures, or invalid temperatures, points, degree
or elements. phases_at raises it for a fraction out of range.