Pressure-temperature diagrams
mdapy.simulation.pressure_temperature_diagram(phases) gives the phase diagram of one
element against pressure and temperature, from the free energies of its
phases at each pressure: at each temperature the phase with the lowest free energy is the
stable one, and where this changes is a boundary.
import numpy as np
from mdapy.build import build_crystal
from mdapy.calculators import LAMMPS
from mdapy.simulation import free_energy, minimize, pressure_temperature_diagram
from mdapy.visualization import plot

potential = LAMMPS(
    "pair_style eam/alloy\npair_coeff * * Cu_mishin1.eam.alloy Cu", elements=["Cu"]
)
crystal = minimize(
    build_crystal("fcc", 3.615, elements="Cu", repeat=(16, 16, 16)),
    potential,
    cell="full",
    max_stress=1e-4,
).system

# around where each pressure melts, not too far above it: a crystal must stay a crystal
windows = {0.0: (1100, 1600), 5.0: (1400, 1700), 10.0: (1600, 1900), 20.0: (1900, 2250)}
options = dict(switching=100, scan=300, repeats=2)
solid, liquid = [], []
for pressure, (low, high) in windows.items():
    temperatures = np.arange(low, high + 1.0, 25.0)
    solid.append(
        free_energy(crystal, potential, temperatures, pressure=pressure, **options)
    )
    liquid.append(
        free_energy(
            crystal,
            potential,
            temperatures[::-1],
            phase="liquid",
            pressure=pressure,
            equilibration=15,
            **options,
        )
    )

diagram = pressure_temperature_diagram({"fcc": solid, "liquid": liquid})
melting = diagram.boundaries[0]
melting.temperatures, melting.slope  # K, K/GPa
diagram.phase_at(10.0, 1650.0), diagram.phase_at(10.0, 1800.0)  # "fcc", "liquid"

with plot.style():
    fig, ax = plot.figure("single")
    plot.pressure_temperature(diagram, ax=ax)
    plot.save(fig, "images/pressure-temperature", formats=("png",))
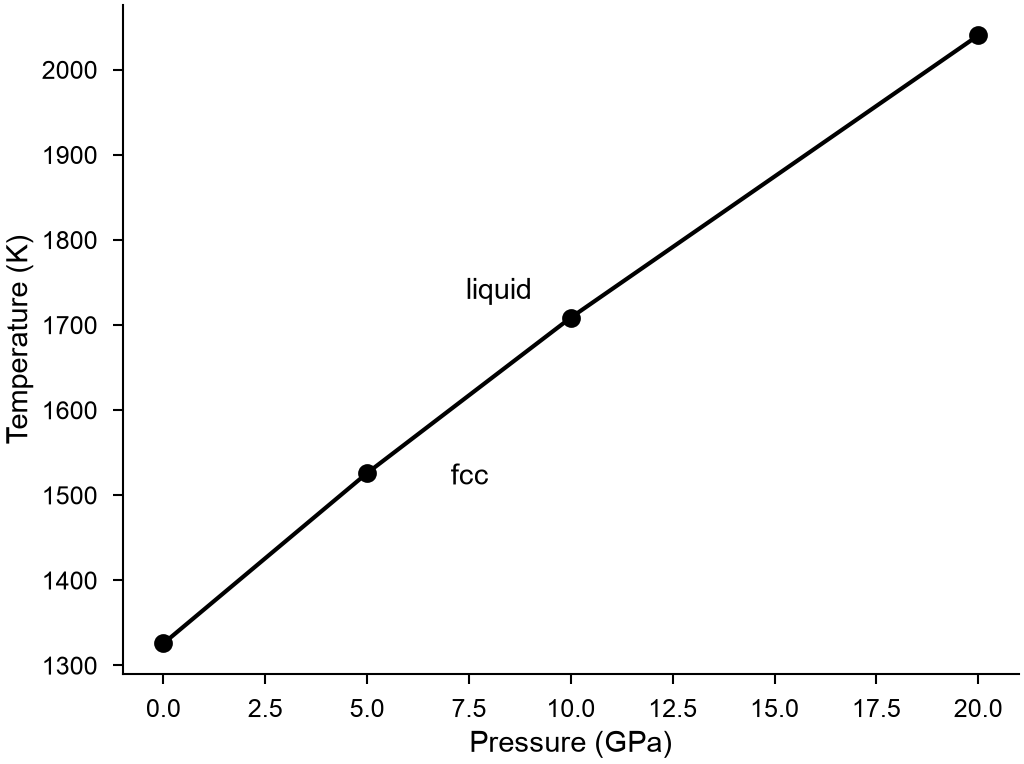
The melting line of copper with the EAM potential of Mishin et al., 16384 atoms: 1326 K at 0 GPa, 1526 K at 5 GPa, 1709 K at 10 GPa and 2040 K at 20 GPa, with slopes of 43, 38, 35 and 31 K/GPa. The two-phase method gives 1326, 1525, 1708 and 2035 K at these pressures, with 16456 atoms.
| Name | Type | Default | Unit | Meaning |
|---|---|---|---|---|
phases |
mapping | for each name of a phase, its free energies, one per pressure, each a FreeEnergyResult of a run at that pressure |
||
points |
int32 | 1001 | the temperatures of the diagram, from the lowest of the free energies to the highest |
Choose the temperatures of each pressure around its boundary. A crystal heated far above
its melting point melts during the scan, and free_energy leaves those
temperatures out with a warning. A boundary is found along the temperature at each
pressure, so one that is nearly flat in temperature, as between two solids, needs pressures
close together. One run of a liquid has an error of about 0.25 meV/atom at 2048 atoms, which
is about 3 K here, so repeats matters more than a long scan.
Results
It returns a PressureTemperatureDiagram; arrays are read-only.
| Attribute or method | Type | Unit | Meaning |
|---|---|---|---|
phases |
tuple of str | the names of the phases | |
pressures |
(P,) float64 | GPa | the pressures |
temperatures |
(T,) float64 | K | the temperatures |
stable |
(P, T) int64 | the index in phases of the phase with the lowest free energy of those known there, or -1 where none is |
|
boundaries |
tuple of PhaseBoundary |
each pair of phases in equilibrium | |
phase_at(pressure, temperature) |
str or None |
the stable phase at the nearest pressure and temperature of the diagram |
A PhaseBoundary:
| Attribute | Type | Unit | Meaning |
|---|---|---|---|
first, second |
str | the phases, the first stable below the temperature of the boundary and the second above it | |
pressures |
(B,) float64 | GPa | the pressures |
temperatures |
(B,) float64 | K | the temperature of the boundary at each pressure |
latent_heat |
(B,) float64 | eV per atom | the change of enthalpy from the first to the second |
volume |
(B,) float64 | ų per atom | the change of volume from the first to the second |
slope |
(B,) float64 | K/GPa | \(\mathrm{d}T/\mathrm{d}P\) by the Clausius-Clapeyron relation |
Definition
At each pressure the stable phase has the lowest Gibbs free energy \(G(T, P)\), and two phases coexist where theirs are equal. Along such a boundary
the Clausius-Clapeyron relation, with \(\Delta V\) and \(\Delta H\) the changes of the volume and the enthalpy from one phase to the other.
plot.pressure_temperature(result, *, ax=None, labels=True) draws the boundaries, with the
names of the phases where each is stable.
Errors
pressure_temperature_diagram raises InvalidParameter for fewer than two phases, too few
points, a free energy without a pressure, or two free energies of one phase at one pressure.
Please cite
Freitas et al. (2016) for the free energies.